Evaluating patents in context
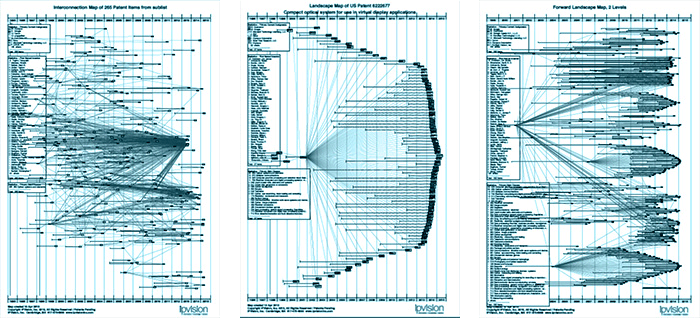
Our interactive patent maps are a key component of our comprehensive technology and patent analysis reports we use to help you identify patent risks, relevance, and best IP strategies:
1. Single Patent Landscape Maps show citation references to and from a single patent, revealing its quality and influence in a specific technology sector.
2. Multi-Patent Landscape Maps, sometimes called Full Patent Landscape Maps, show citations to and from a starting set of patents—useful for understanding the evolution of a patent portfolio over time.
3. Patent Family Maps show legally-related patent filings and grants across priority and legal relationships, both domestically and internationally, if needed.
4. Patent Interconnection Maps display the patent citation references among a specific group of patents
We believe that to develop an accurate understanding of patent importance, it’s vital to evaluate them in context. Our proven Relative Citation Frequency process not only looks at the number of citations given to a specific patent, but ranks that patent in comparison to all others of similar age in the same technology category. This process accurately qualifies the citation count based on patent age and technology segment far beyond simple citation counting.
But our patent analysis doesn’t stop there. We take additional steps to ensure accurate valuation by utilizing algorithms we developed to quickly and efficiently segment a patent portfolio into families based on relationships, continuations, and divisionals, including foreign patents.


